1. Total active User on Facebook is 1.44 billion which is 15% increase year over year (March 2015).
2. Total number of daily active users in March 2015 was 936 million which is 70 % increase over the year 2014.
3. Monthly active user increase Year over Year is 13%. (April 2015)
4. Mobile active user on Facebook is 1.44 billion which is 26% increase Year over Year.
5. Number of fake profiles on Facebook is reported to be over 83 million.
6. Total photo uploads per day is around 300 million. This shows the user engagement on the platform.
7. Every minute, 510 comments are posted, 293000 status are updated and 136000 photos are uploaded. The user engagement is superb and it shows the engagement from active users.
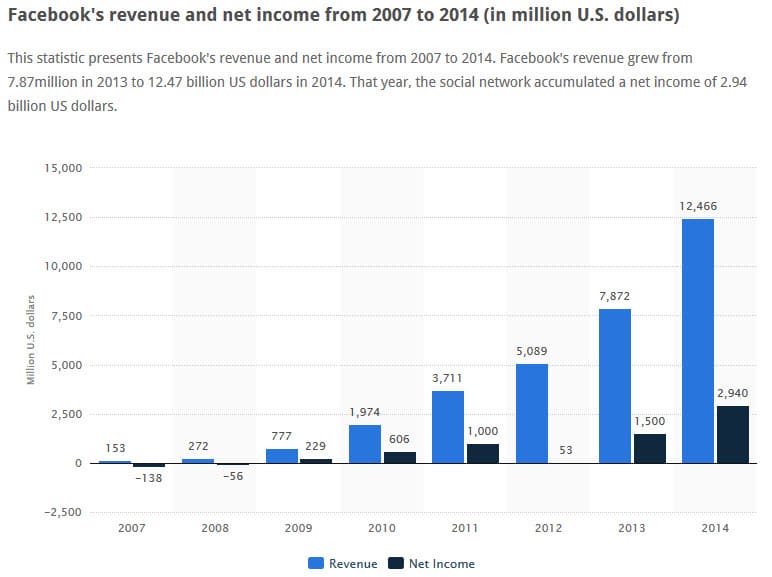
8. Total revenue generated by Facebook is $12466 million. This is a result of huge user engagement and ads revenue generated through Facebook.
9. Number of employees with Facebook is working is 10082. Since the number looks small according to the company’s name but they all are fine enough and are doing awesome in their work.
10. 42% of marketers accepted that Facebook is critical to their business. The market is competitive and one needs to use Facebook fan page correctly to market on.
11. 19 million businesses have optimized their Fan Page for mobile which encouraged the marketers to reach more to their target customers.
12. Businesses are paying 122% more per ad unit on Facebook than they did just a year ago.
13. 1.5 million Businesses now spend money on Facebook ads. They all are now quite familiar with the changing market trend and they have adopted it too.
14. 399 million Facebook users only use Facebook on mobile each month.
15. 829 million people use Facebook on a daily basis, an increase from 802 million last quarter.
16. Businesses spent $2.66 billion on Facebook advertising, an increase from $2.27 billion last quarter. This is a result of the ROI of advertisement on Facebook.
17. Facebook users bought $234 million worth of virtual goods and gifts on Facebook over the last quarter. As a result of various ads being played on the Facebook page, users have an option to check the product directly from a single click.
18. Size of 300 petabytes (3lacs terabyte) is used to store the indormation of the users. This database stores all the information of the users worldwide and keeps the backup for any emergency need.
19. Percentage growth of Facebook in Asia Pacific is reported to be 28-32% by 2015.
20. Percentage of internet user who is above 65 years and uses Facebook has raised comparatively and has reached to 45%.
21. Penetration into India: 9%.
22. No of Facebook users in India has touched 110 million.
23. Percentage of millionaire using Facebook is 57%.
24. Percentage of global online population using Facebook is 38.6%.
25. Projected advertisement revenue by 2016 is $17.23 billion. This is a result of the growth of digital marketing and social media.
26. Average advertisement revenue per user comes to be $8.25.
27. Average number of users playing games on FB per month has reached over 250+ million. This has shown the engagement of people on the social media gaming platform.
28. Monthly active user on candy crush saga through Facebook is 148.69 million. This is the most engagement game on Facebook platform.
29. Active users for kings.com on Facebook is 267.81 million.
30. 30 million businesses now have a Facebook Fan Page. To promote the business and advertise their products, people create their business page for user engagement.


